Debugging
Debugging programs is hard. Even the best developers make mistakes. That is why the best developers know their way around a debugger and have sound strategies for diagnosing and fixing code issues even when the code belongs to someone else. You may need to debug a code in the following cases:
- Code crashes randomly, stopping the application and losing data
- Results are wrong or different from previous versions
- Divide by zero
- You need to optimize code based on profiling results
- Network communication is not working
- Multi-threaded code is deadlocking
Generic debugging steps
A generic workflow must be followed to debug any source code or software on your own, go to the directory with your code sources and compile your program with debugging flags -g (for more information about compilation steps please visit Compiling page). Then you can use either opensource debuggers such as GDB, Valgrind or debuggers coming from specialised toolkits such as Arm Forge (DDT and MAP) or Intel OneAPI (VTune, ITAC, Advisor).
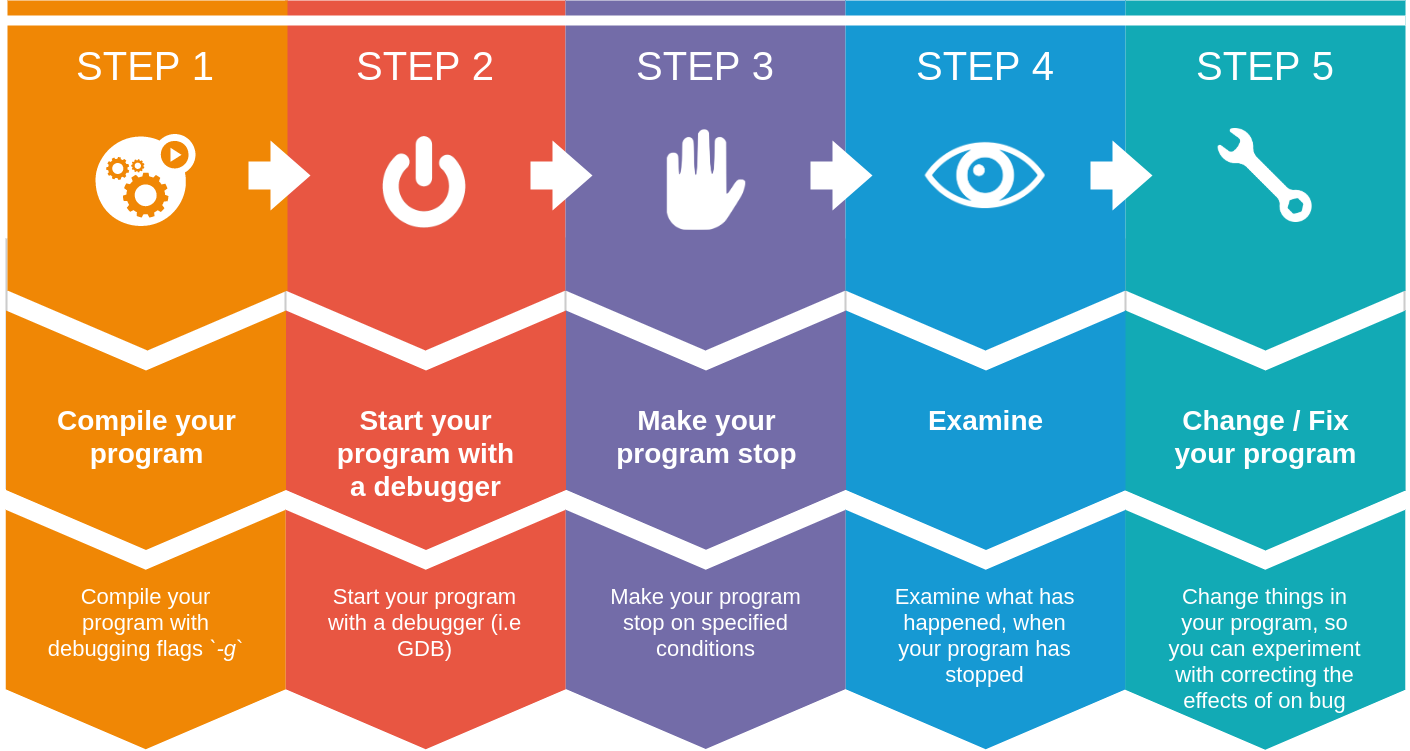
The debugging workflow can be divided into five main steps as detailed in the above diagram:
- Compile your program with debugging flags
-g - Start your program.
- Make your program stop on specified conditions.
- Examine what has happened, when your program has stopped.
- Change things in your program, or its compilation, so you can experiment with correcting the effects of one bug and go on to learn about another.
Debugging flags
For more detailed during the debugging process, the program must be compiled with debugging flags switched on -g.
Valgrind
Valgrind is a program for debugging and profiling Linux executables. It consists of a core, which provides a synthetic CPU in software, and a series of debugging and profiling tools. The architecture is modular, such that new tools can be created easily and without disturbing the existing structure. One of the most popular uses of Valgrind is to check for memory leaks using the Memcheck tool, as it can detect memory-related issues in C and C++ programs. Valgrind works by emulating one or more CPUs. Hence, it can intercept and inspect your unmodified, running program in ways which would not be possible otherwise. It can for example check that all variables have actually been assigned before use, that all memory references are within their allowed space, even for static arrays and arrays on the stack.
Info
The biggest downside to Valgrind is that it will make your program run much slower. Typically, the program will run 10-100 times slower under Valgrind.
Debugging a serial program
If you used to running your program like this:
myApplication arg1 arg2
The following runs Valgrind with the default memcheck “tool”, which checks memory consistency. When run without any extra flags, Valgrind will produce a balanced, not overly detailed and informative output.
module load Valgrind
valgrind --leak-check=yes myApplication arg1 arg2
If you need a more detailed (but slower) report, run Valgrind with:
valgrind --leak-check=full --track-origins=yes --show-reachable=yes -s myApplication
Let's try to debug and study a test program. The sample program provided below allocates memory and fails to delete it. The simple leak-test app takes a single parameter which is the size in bytes of the memory to be allocated.
1 2 3 4 5 6 7 8 9 10 11 12 13 14 15 16 17 18 | |
To compile the program, use the following command:
g++ -g mem_check.cpp -o test_memcheck
Once the program is freshly compiled you can execute it with valgrind the following command:
valgrind --leak-check=full --track-origins=yes --show-reachable=yes -s ./test_memcheck 1000
Output
==41678== Memcheck, a memory error detector
==41678== Copyright (C) 2002-2017, and GNU GPL'd, by Julian Seward et al.
==41678== Using Valgrind-3.16.1 and LibVEX; rerun with -h for copyright info
==41678== Command: ./test_memcheck 1000
==41678==
Program run properly
==41678==
==41678== HEAP SUMMARY:
==41678==     in use at exit: 4,000 bytes in 1 blocks
==41678==   total heap usage: 3 allocs, 2 frees, 77,728 bytes allocated
==41678==
==41678== 4,000 bytes in 1 blocks are definitely lost in loss record 1 of 1
==41678==    at 0x483D583: operator new[](unsigned long) (vg_replace_malloc.c:431)
==41678==    by 0x109285: main (in /home/alban/Documents/user-documentation/docs/hpc/src/test_memcheck)
==41678==
==41678== LEAK SUMMARY:
==41678==    definitely lost: 4,000 bytes in 1 blocks
==41678==    indirectly lost: 0 bytes in 0 blocks
==41678==      possibly lost: 0 bytes in 0 blocks
==41678==    still reachable: 0 bytes in 0 blocks
==41678==         suppressed: 0 bytes in 0 blocks
==41678==
==41678== ERROR SUMMARY: 1 errors from 1 contexts (suppressed: 0 from 0)
This output clearly states that there is a memory-leak. There are many kinds of memory-leaks; two important ones are:
definitely lost: you have a memory-leak.probably lost: you may have a memory-leak, unless you are doing something funny with moving heap pointers around.
Debugging multi tasks program (MPI)
As for serial program, you can debug multitasks/MPI program with valgrind with little change in previous serial program commands.
After loading the Valgrind module, you can perform a memory leak check with the following command:
module load Valgrind
srun -n $SLURM_NTASKS valgrind --leak-check=yes myApplication arg1 arg2
For a complete memory leak check:
srun -n $SLURM_NTASKS valgrind --leak-check=full --track-origins=yes --show-reachable=yes myApplication arg1 arg2
Debugging Multi-threadted program (OpenMP)
If you have a multi-threaded program (e.g. OpenMP, pthreads), and you are unsure if there might be possible deadlocks or data races lurking in your program, the Valgrind thread checker is your best friend. The thread checking tool is called helgrind:
export OMP_NUM_THREADS=2
valgrind --tool=helgrind myApplication
For more information on using Valgrind please refer to the man pages and the Valgrind manual which can be found on the Valgrind website or the Valgrind Quick Start Guide.
ARM DDT
Arm DDT is a powerful, easy-to-use graphical debugger. It provides a complete solution for finding and fixing problems on a single thread or across hundreds of thousands of threads. You can use Arm DDT to debug OpenMP, parallel (MPI) software, heterogeneous software such as that written to use GPUs, hybrid codes mixing paradigms such as MPI + OpenMP, or MPI + CUDA, and multi-process software of any form, including client-server applications.
Basic usage with details: On a MeluXina compute node where the X11 agent has been forwarded:
Reminder
To enable X11 forwarding on MeluXina, please refer to Connecting page.
module load Forge
ddt
Core File
The core file is the snapshot of the memory of your application, taken by the Operating System when the application died. The first thing to do is to discover where the application has died.
Generating a core file
The best way is to set the ulimit so that your program generates a core file when it crashes. Then you can try to work out what the problem was by examining the core.
You can then visualize the core file with GDB or DDT.
ulimit -c unlimited
1 2 3 4 5 6 7 8 9 10 11 12 13 14 15 16 17 18 | |
To compile the program use the following command:
g++ test_corefile.cpp -g -o test_corefile
Debugging flags
To compile a buggy program don't forget to enable the debugging flags using the option -g
Then to run and generate the core file for the freshly compiled code use the following commands:
ulimit -c unlimited
./test_corefile
The program crashes and creates a corefile, we can then examine the corefile with different tools to understand where the error comes from.
Examining a core file
Examining with GDB
Core files can be examined specifying both an executable program and the core file:
module load GDB
gdb myApplication corefile_name
With the previous example, use the following command:
gdb ./test_corefile core
Output
GNU gdb (Ubuntu 9.2-0ubuntu2) 9.2
Copyright (C) 2020 Free Software Foundation, Inc.
License GPLv3+: GNU GPL version 3 or later <https://gnu.org/licenses/gpl.html>
This is free software: you are free to change and redistribute it.
There is NO WARRANTY, to the extent permitted by law.
Type "show copying" and "show warranty" for details.
This GDB was configured as "x86_64-linux-gnu".
Type "show configuration" for configuration details.
For bug reporting instructions, please see:
<https://www.gnu.org/software/gdb/bugs/>.
Find the GDB manual and other documentation resources online at:
    <https://www.gnu.org/software/gdb/documentation/>.

For help, type "help".
Type "apropos word" to search for commands related to "word"...
Reading symbols from ./test_corefile...

warning: exec file is newer than core file.
[New LWP 48788]
Core was generated by `./test_corefile'.
Program terminated with signal SIGFPE, Arithmetic exception.
#0  0x000056365855a1ce in main (argc=1, argv=0x7ffd1d64edb8) at test_corefile.cpp:11
11         int res= var/div;
GDB will highlight the line which causes the crash of the program. In our case the line 11 where a value is divided by 0.
Examining with DDT
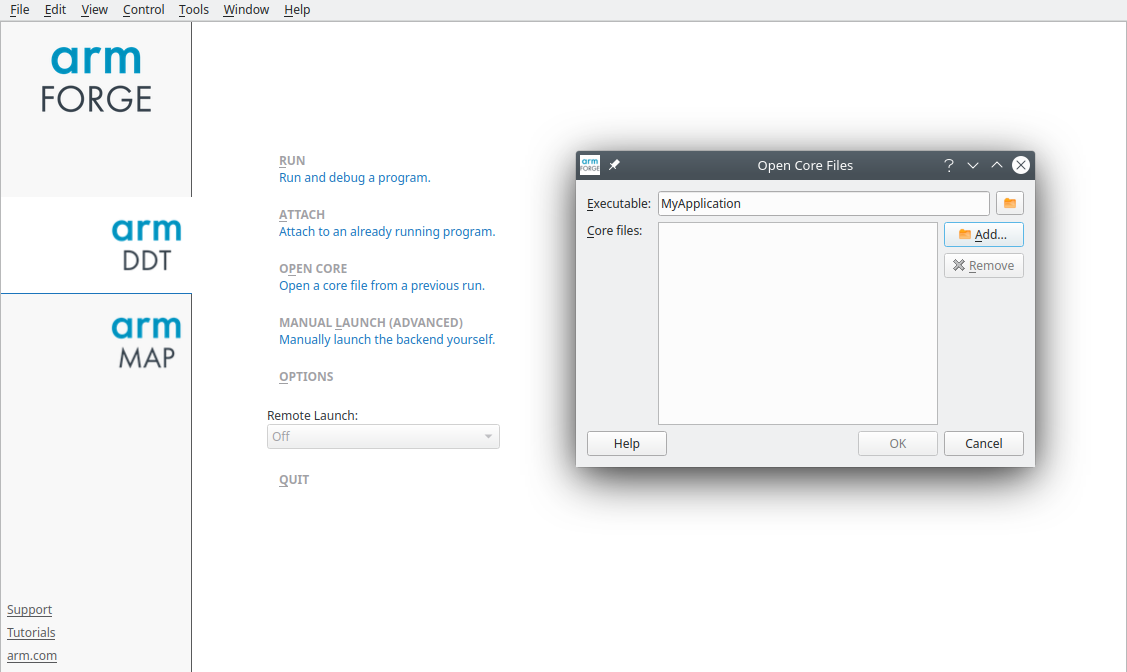
DDT allows you to examine core files generated by a program. Start DDT without arguments and select Open Core Files on the Welcome Screen. This allows for selecting an executable and a core file to debug.
module load Forge
ddt
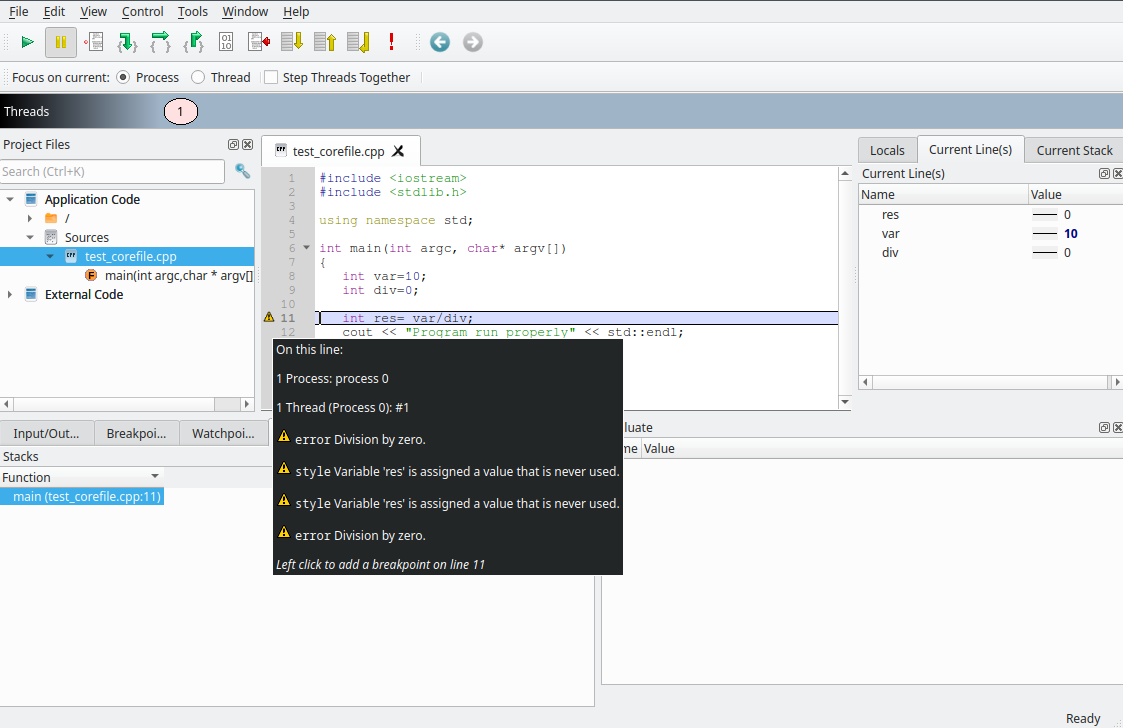
Once the corefile and the executable are selected and loaded, DDT highlights the line which causes the crash of the program and gives you some advices to fix it.
Once the corefile and the executable are selected and loaded, DDT highlights the line which causes the crash of the program and gives you some advices to fix it.