Profiling
Profiling is always the first step of performance optimization. It is a time-consuming process and to maximize return on investment, it is critical to understand where the quick wins are.
Within the MeluXina software stack various profiling tools including are available, including Arm-Forge, Intel-VTune, Extrae-Paraver, and Valgrind. Most of them offer a graphical interface that can be used with X11 forwarding.
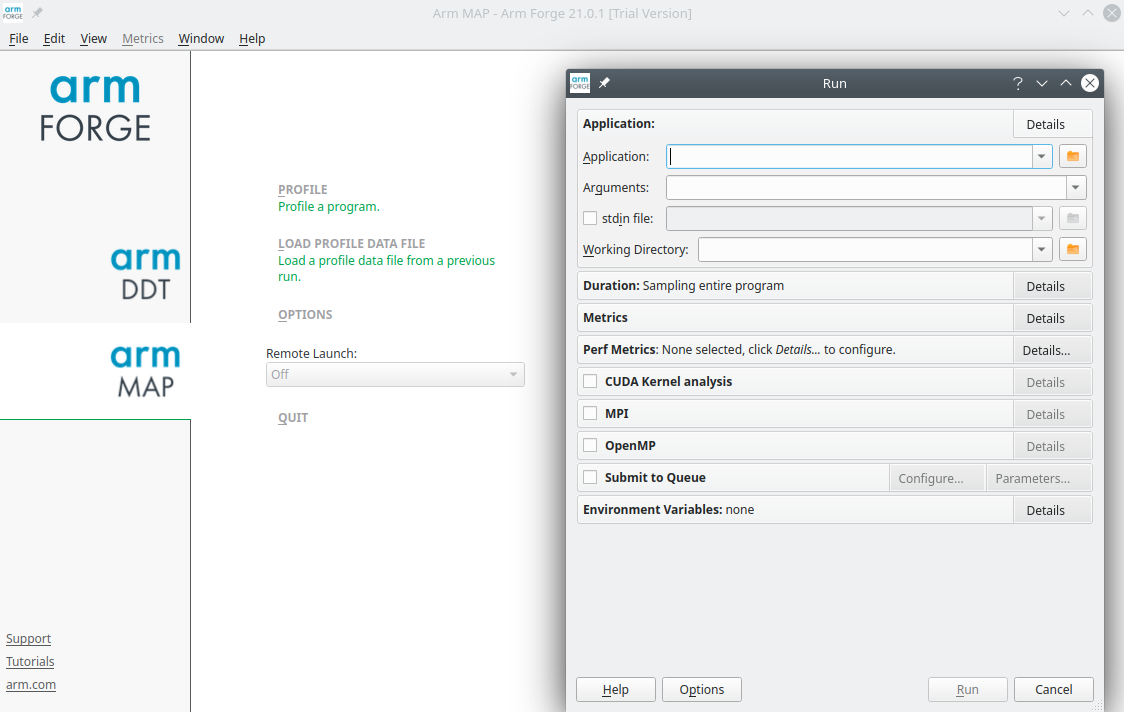
ARM Map
module load Arm-Forge/21.1.1-GCC-10.3.0
map
ARM MAP is a source-level profiler and can show how much time was spent on each line of code. To see the source code in MAP compile your program with the debug flag/
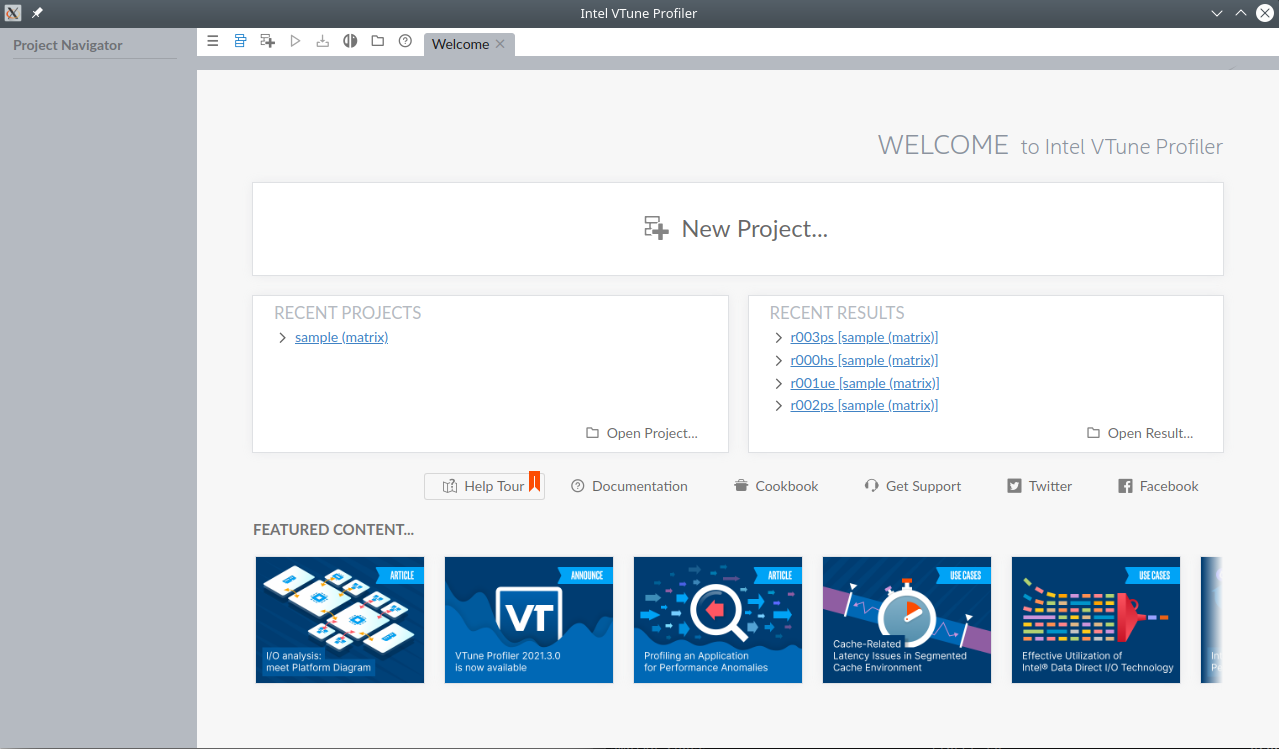
Intel Vtune
Intel Vtune Amplifier is a versatile serial and parallel profiler, with features such as stack sampling, thread profiling and hardware event sampling.
module load VTune
vtune-gui
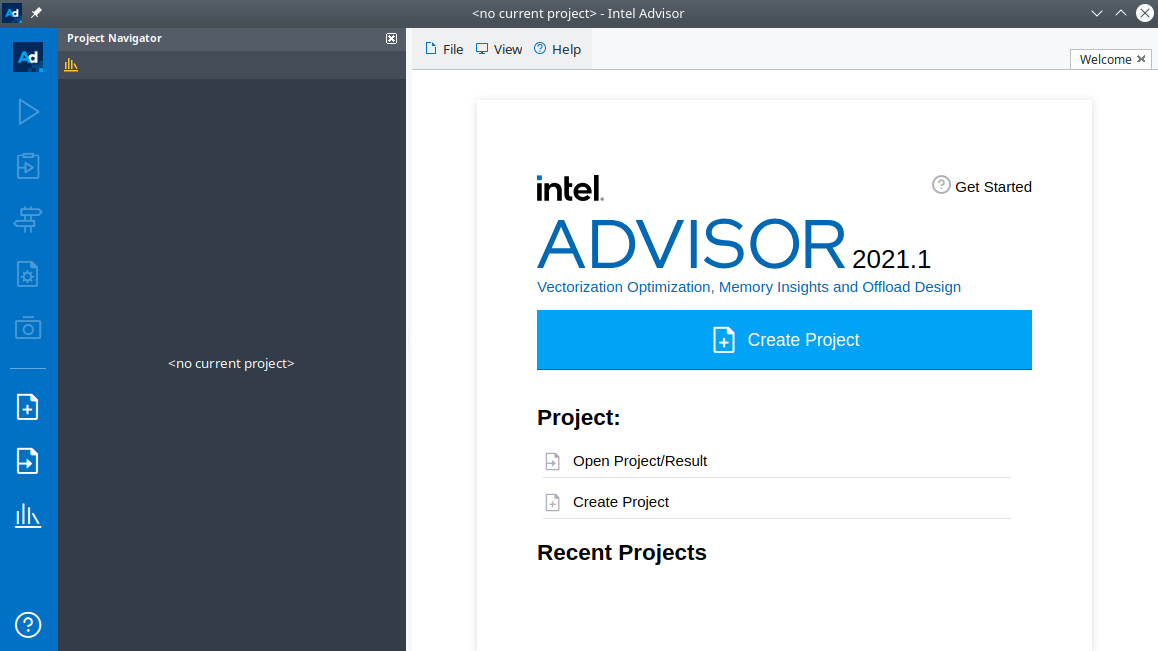
Intel Advisor
Intel Advisor (also known as Advisor XE, Vectorization Advisor or Threading Advisor) is a design assistance and analysis tool for SIMD vectorization, threading, memory use, and GPU offload optimization. The tool supports C, C++, Data Parallel C++ (DPC++), Fortran and Python languages.
module load Advisor
advisor-gui
Other Profiling Tools
There is a wide array of profiling tools available, each tailored to different applications or programming languages. These tools are essential for identifying performance bottlenecks, optimizing code, and ensuring efficient resource utilization. You can check this example for a short demo for multiprocessing in Python.
Profile Guided Optimization
The Intel compilers can do something called Profile Guided Optimization (PGO). This uses information from the execution of the application to create more effective code. It is important that you run the application with a typical input set or else the compiler will tune the application for another usage profile than you are interested in. With a typical input set one means for instance a full spatial input set, but using just a few iterations for the time stepping.

- Compile with
-prof-gen. - Run the application/software.
- Recompile with
-prof-use.
Best practices
The simplest case is to compile/run/recompile in the same folder or else you need to use the -prof-dir flag, see the manual for details